Contact Person: C. Argiropoulos [argiropoulosc@gmail.com]
The current project is dedicated to the understanding of the mechanisms of heat transfer occurring in controlled flow boiling scenarios over porous coated surfaces. The potential of heat transfer enhancement is of great importance to heat exchangers’ efficient design and application. Boiling heat transfer involves a thermally saturated liquid state where the liquid isothermally transcends from the liquid to the gas phase, due to a latent heat addition into the fluid volume.
In recent years, the role of porous surfaces in boiling heat transfer enhancement has received serious attention. The increasing scientific interest along with complex and largely unexplored physics on the context of heat and mass transfer interactions at micro-scale geometries, highlight a fundamental difficulty in quantifying and predicting the outcome of certain flow boiling scenarios with variable working conditions. Porous surfaces affect the bubble dynamics of traditionally hydrophilic boiling surfaces and transform their nature into a hybrid, pseudo-hydrophobic state. Qualitatively, entrapment of small vapor quantities inside the complex porous structures triggers early nucleation, resulting in the initial creation of many bubbles. Early detachment and/or condensation acts in favor of the heat transfer enhancement due to fact that the surface is cleared, and new bubbles can grow. Clearly enough, the bubble dynamics conceptually engulf the interrelationships involved in the physical domain of boiling heat transfer.
The project’s main task is the experimental validation of structured porous substrates as boiling enhancing surfaces, using a combination of classical and non – classical experimental approach. For the needs of this study an existing experimental facility which has been designed to study flow boiling under certain conditions, is being used. Additionally, a novel test section has been designed and fabricated to house a special kind of porous coatings. At figure 1 the main section of the flow loop is depicted, while at figure 2, a close-up view of the boiling section is depicted.
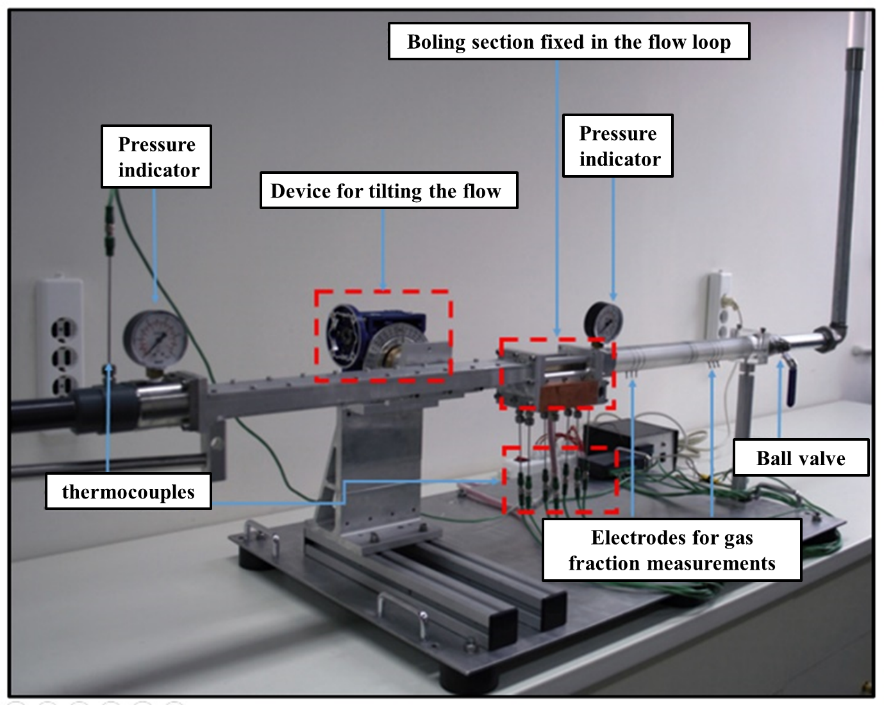
Figure 1: Main section of experimental flow boiling loop.
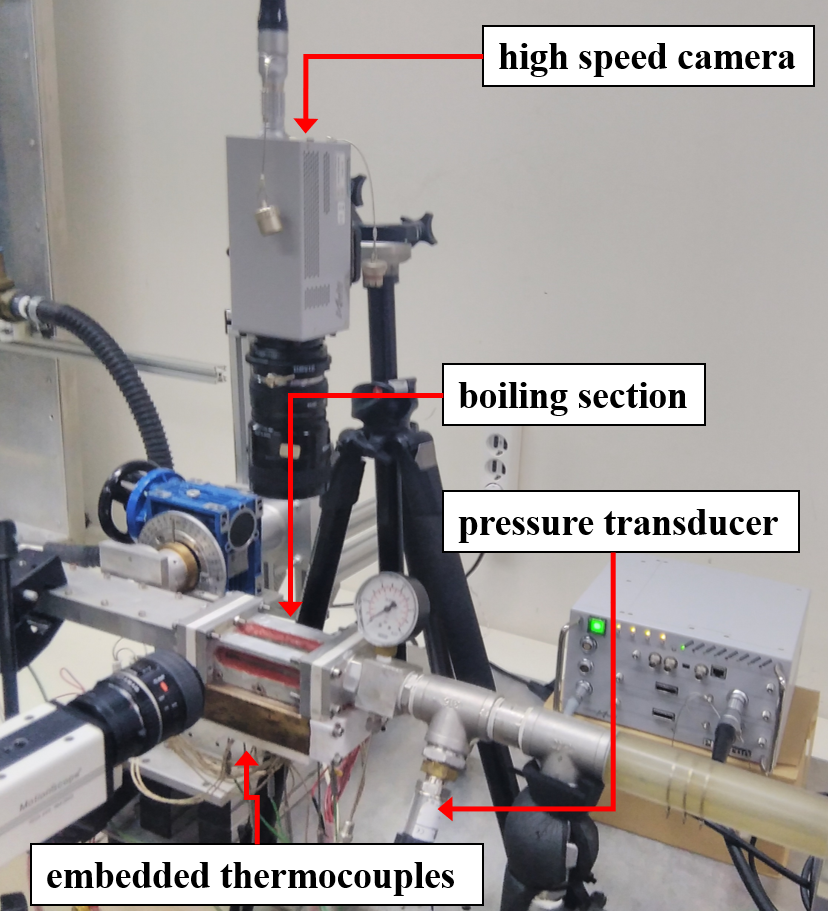
Figure 2: Close-up view of flow boiling section.
Metallic woven screens
Metallic woven screens are common engineered materials used in a variety of applications related to filtering and electromagnetic shielding. They are characterized by the mesh number, M, which defines the number of wires (or gaps) per unit length. They can be easily fabricated to sufficiently large mesh number to have a micro-scale, uniform, porous – like geometry. For this study, copper woven screens of varying dimensions are experimentally tested as boiling surfaces. At figure 3, a geometrical illustration is presented. The porosity of the copper screens varies according to the mesh number, the wire diameter, d, and aperture, a. Due to the exact geometrical features, it can be easily calculated, as shown at Figure 4. The dashed lines correspond to the geometry of three different metallic screens used in the current study. As seen, the porosity reduces as wire diameter increases, while the reduction is even greater as the mesh number increases. Video 1 demonstrates the geometry variation of a mesh with constant mesh number as the wire diameter increases.
The screens are inserted and fixed in the boiling section as shown at video 1. Each experiment is performed at a different boiling surface of a specific screen type and thickness (number of layers). Recordings of indicative temperature measurements at the solid boiling surface as well as the fluid inlet and outlet provide clues about the surface heat transfer performance. Most importantly, high speed imaging of the two-phase flow field is documented, thus giving further insight to the complex liquid – vapor interactions. It is remarked that to evaluate the screens’ performance, experiments for smooth reference surface (without screen insertion) are also being performed. Finally, to confirm the screens’ apparent hydrophobic state, contact angle measurements have been performed as shown at figure 6.
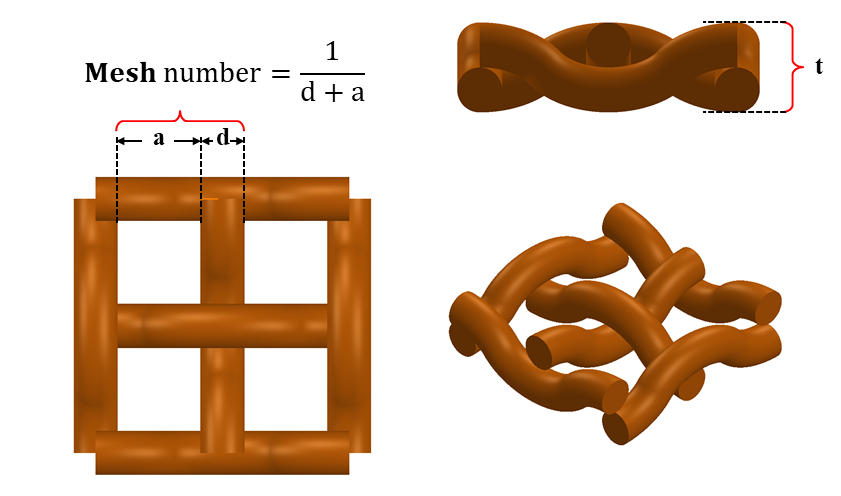
Figure 3: Geometrical illustration of copper mesh screens

Figure 4: Porosity variation with wire diameter for different mesh number.
Video 1: Copper mesh screen geometry variation as the diameter increases.

Video 2: Assembly model of copper mesh screen surface to boiling channel.

Results
The initial results provided evidence of enhanced heat transfer for certain cases. Especially the insertion of a single screen layer fundamentally alters the two-phase flow regime and the heat transfer mechanism. Boiling curves (Fig. 5) suggest enhanced heat transfer for certain regions. In contrast with the plain surface, in which the path of the curve is continuous, at the copper screen surface a sudden jump marks a two-phase transition, as the heat flux increases. As the mass flux increases the jump occurs at higher wall temperature. The appearance of intense pressure oscillations (Fig. 6), inherent to a unique cyclic flow regime transition, is characteristic of hydrodynamically unstable flow, which, in the particular case, is advantageous to heat transfer. Image analysis is employed to establish flow regime maps (Fig. 7) and examine the two-phase perpendicular flow field (Fig. 8) to quantify the time intervals in between the different regimes and ascertain their importance in the total heat transfer. Intense boiling events (Vid. 3) and vapor film spreading (Vid. 4) have been captured using a high speed camera, depicting the evolution of the two-phase flow field in very small time intervals. 10,000 fps
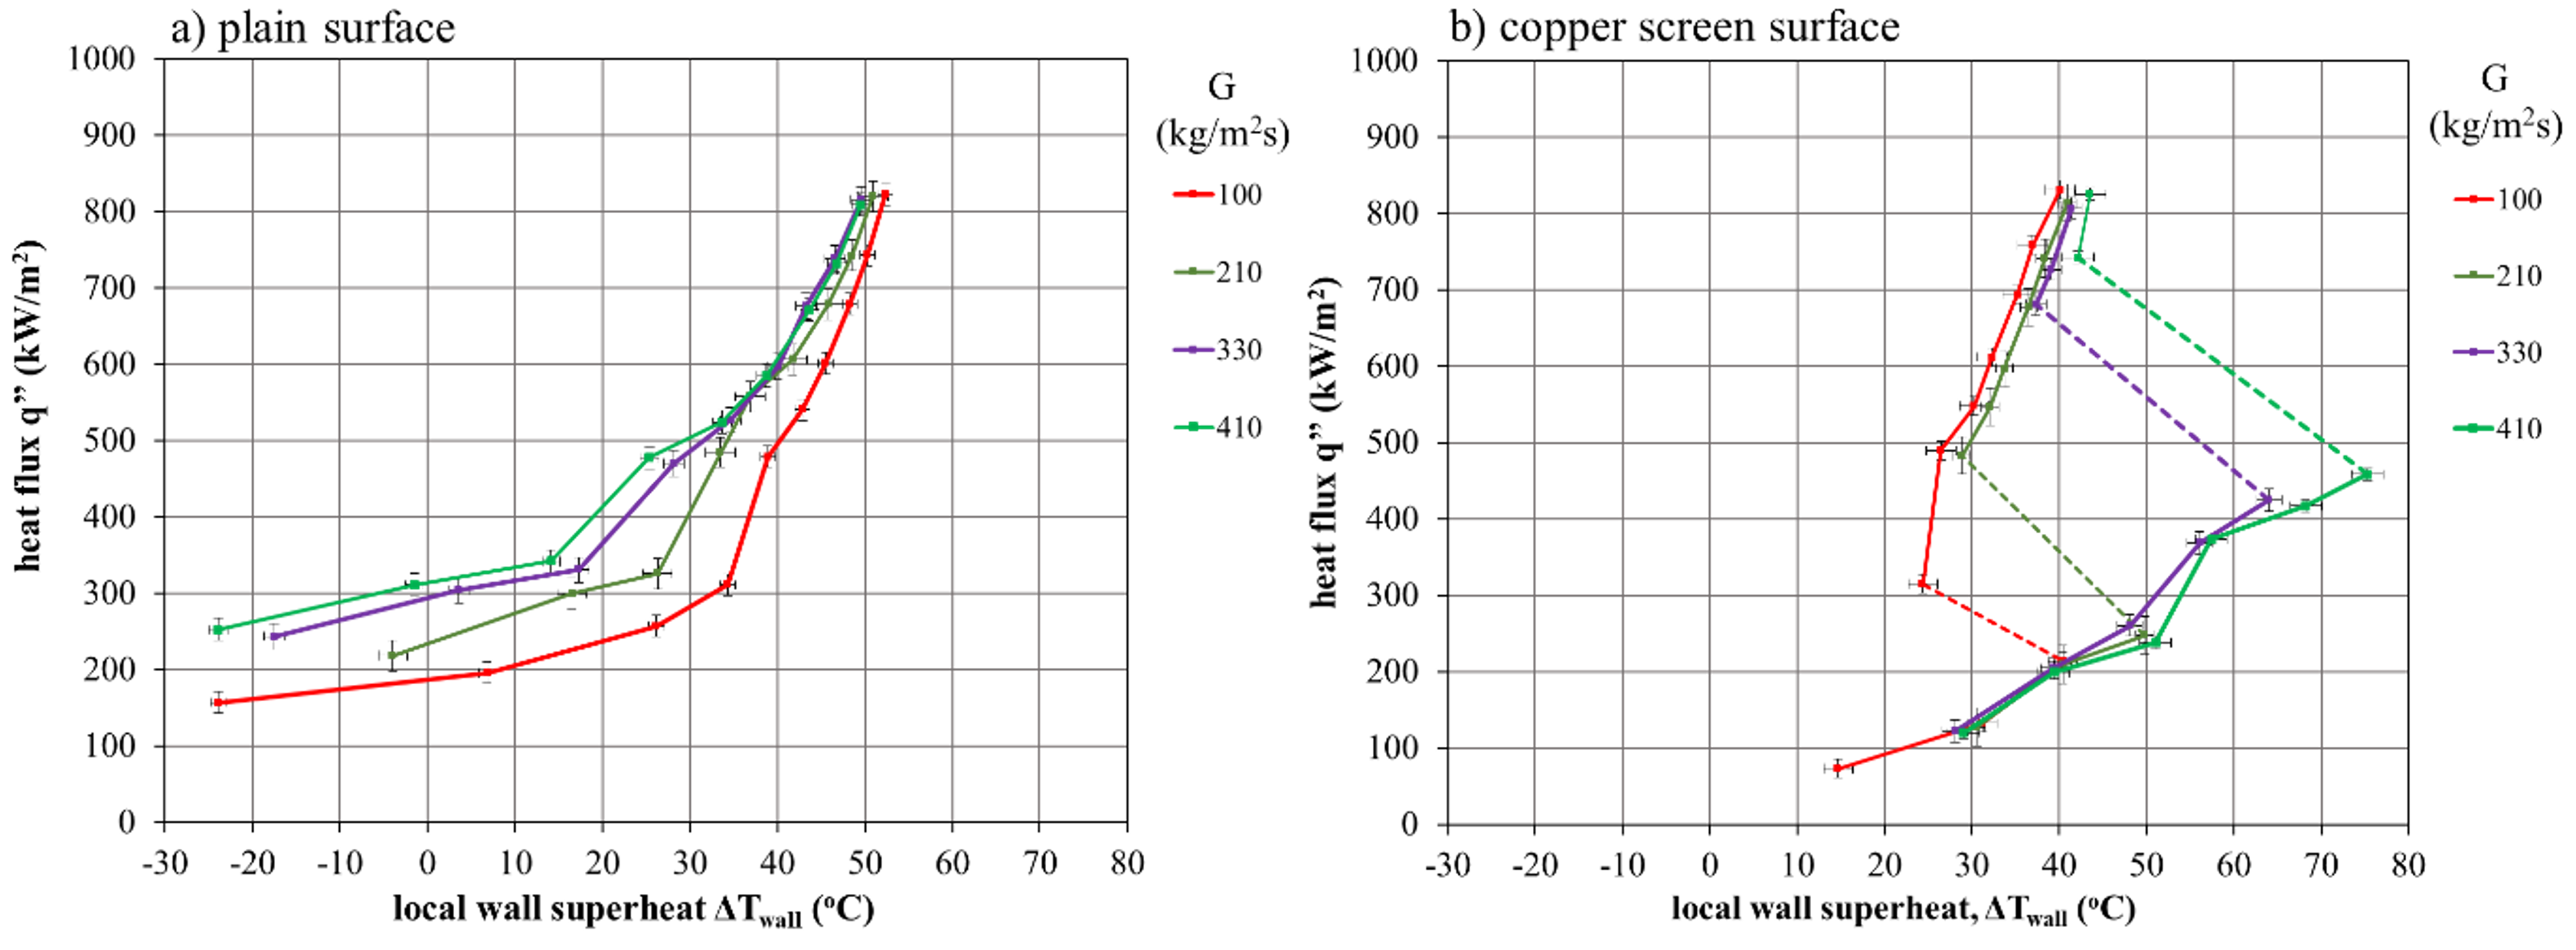
Figure 5: Summary of boiling curves for a) plain surface b) copper screen surface (single layer – M80)
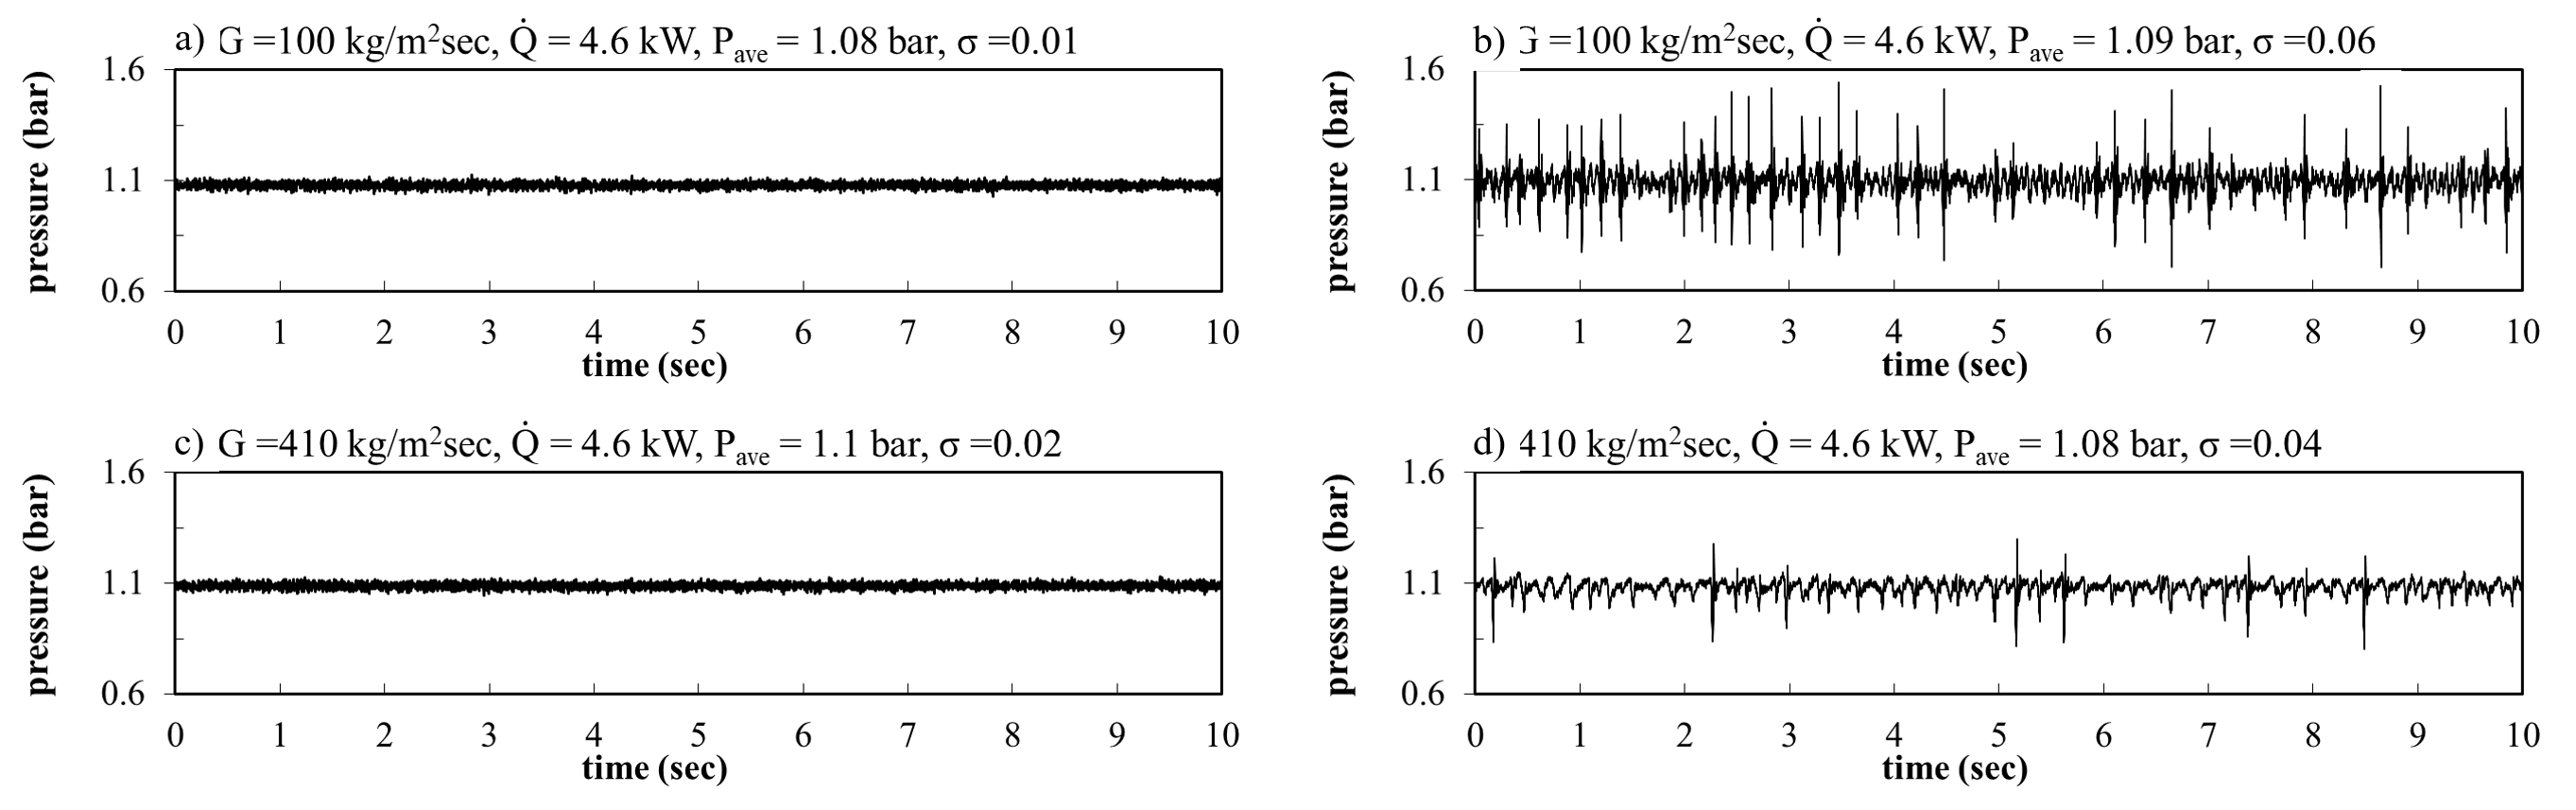
Figure 6: Pressure profiles at G = 100 kg/m2s, “Q” ̇ = 4.6 kW: a) plain surface, b) copper screen covered surface. Pressure profiles at G = 4100 kg/m2s, “Q” ̇ = 4.6 kW: c) plain surface, d) copper screen covered surface
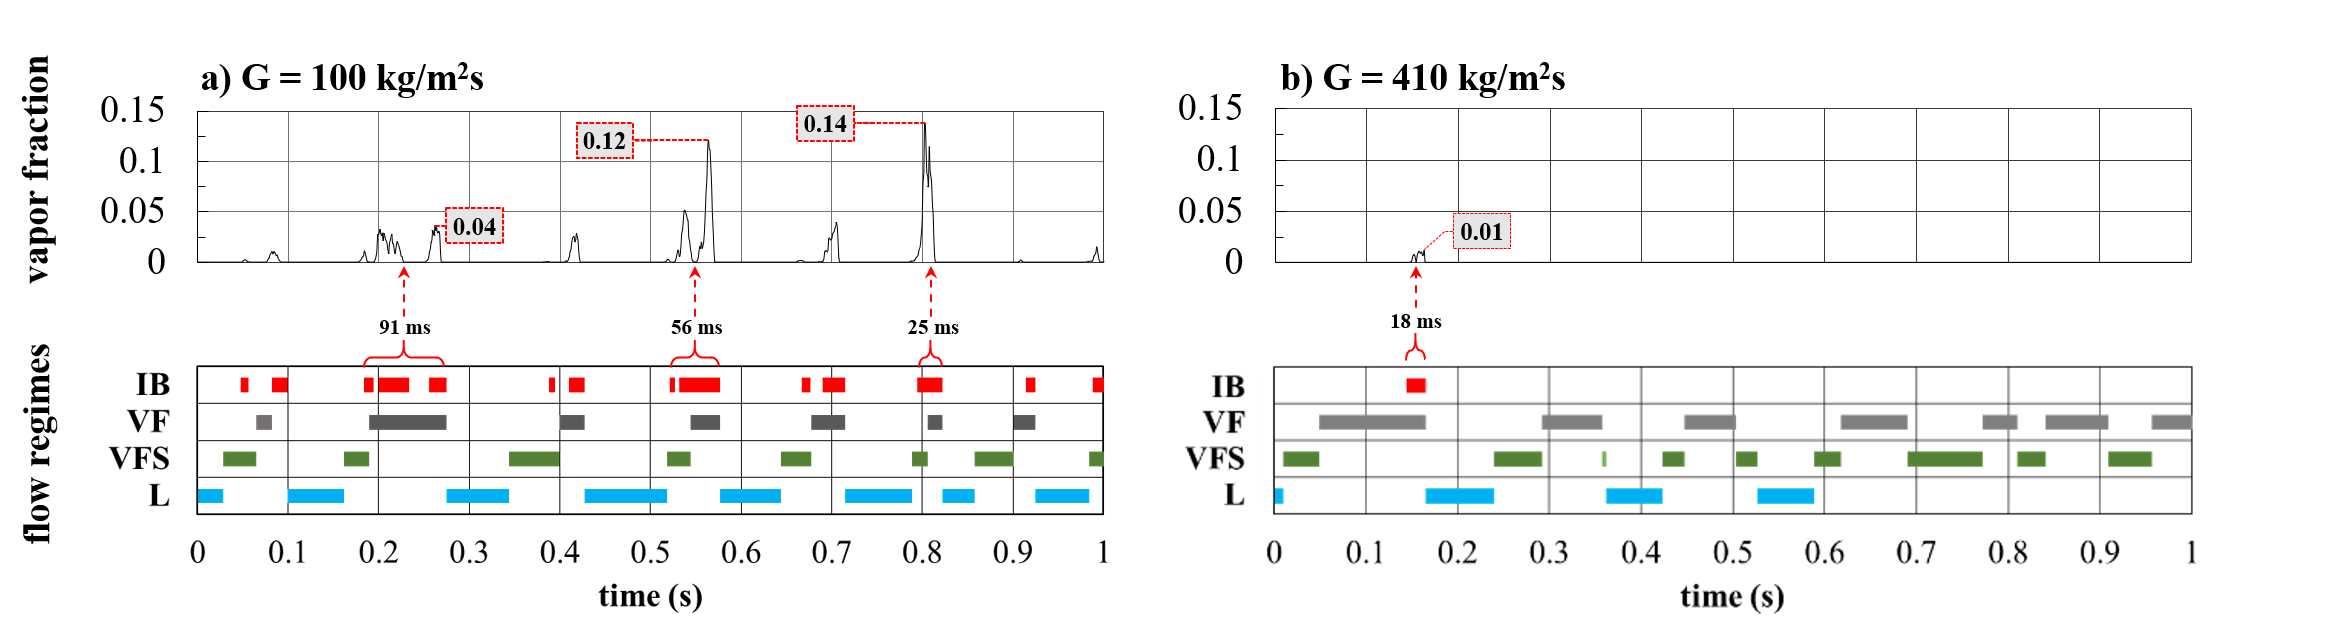
Figure 7: Indicative instantaneous vapor fraction and flow regime timelines, Q ̇ = 4.6 kW, a) G = 100 kg/m2s, b) G = 410 kg/m2s (IB –> intense boiling, VF –> Vapor film, VFS –> Vapor film spread, L –> Liquid
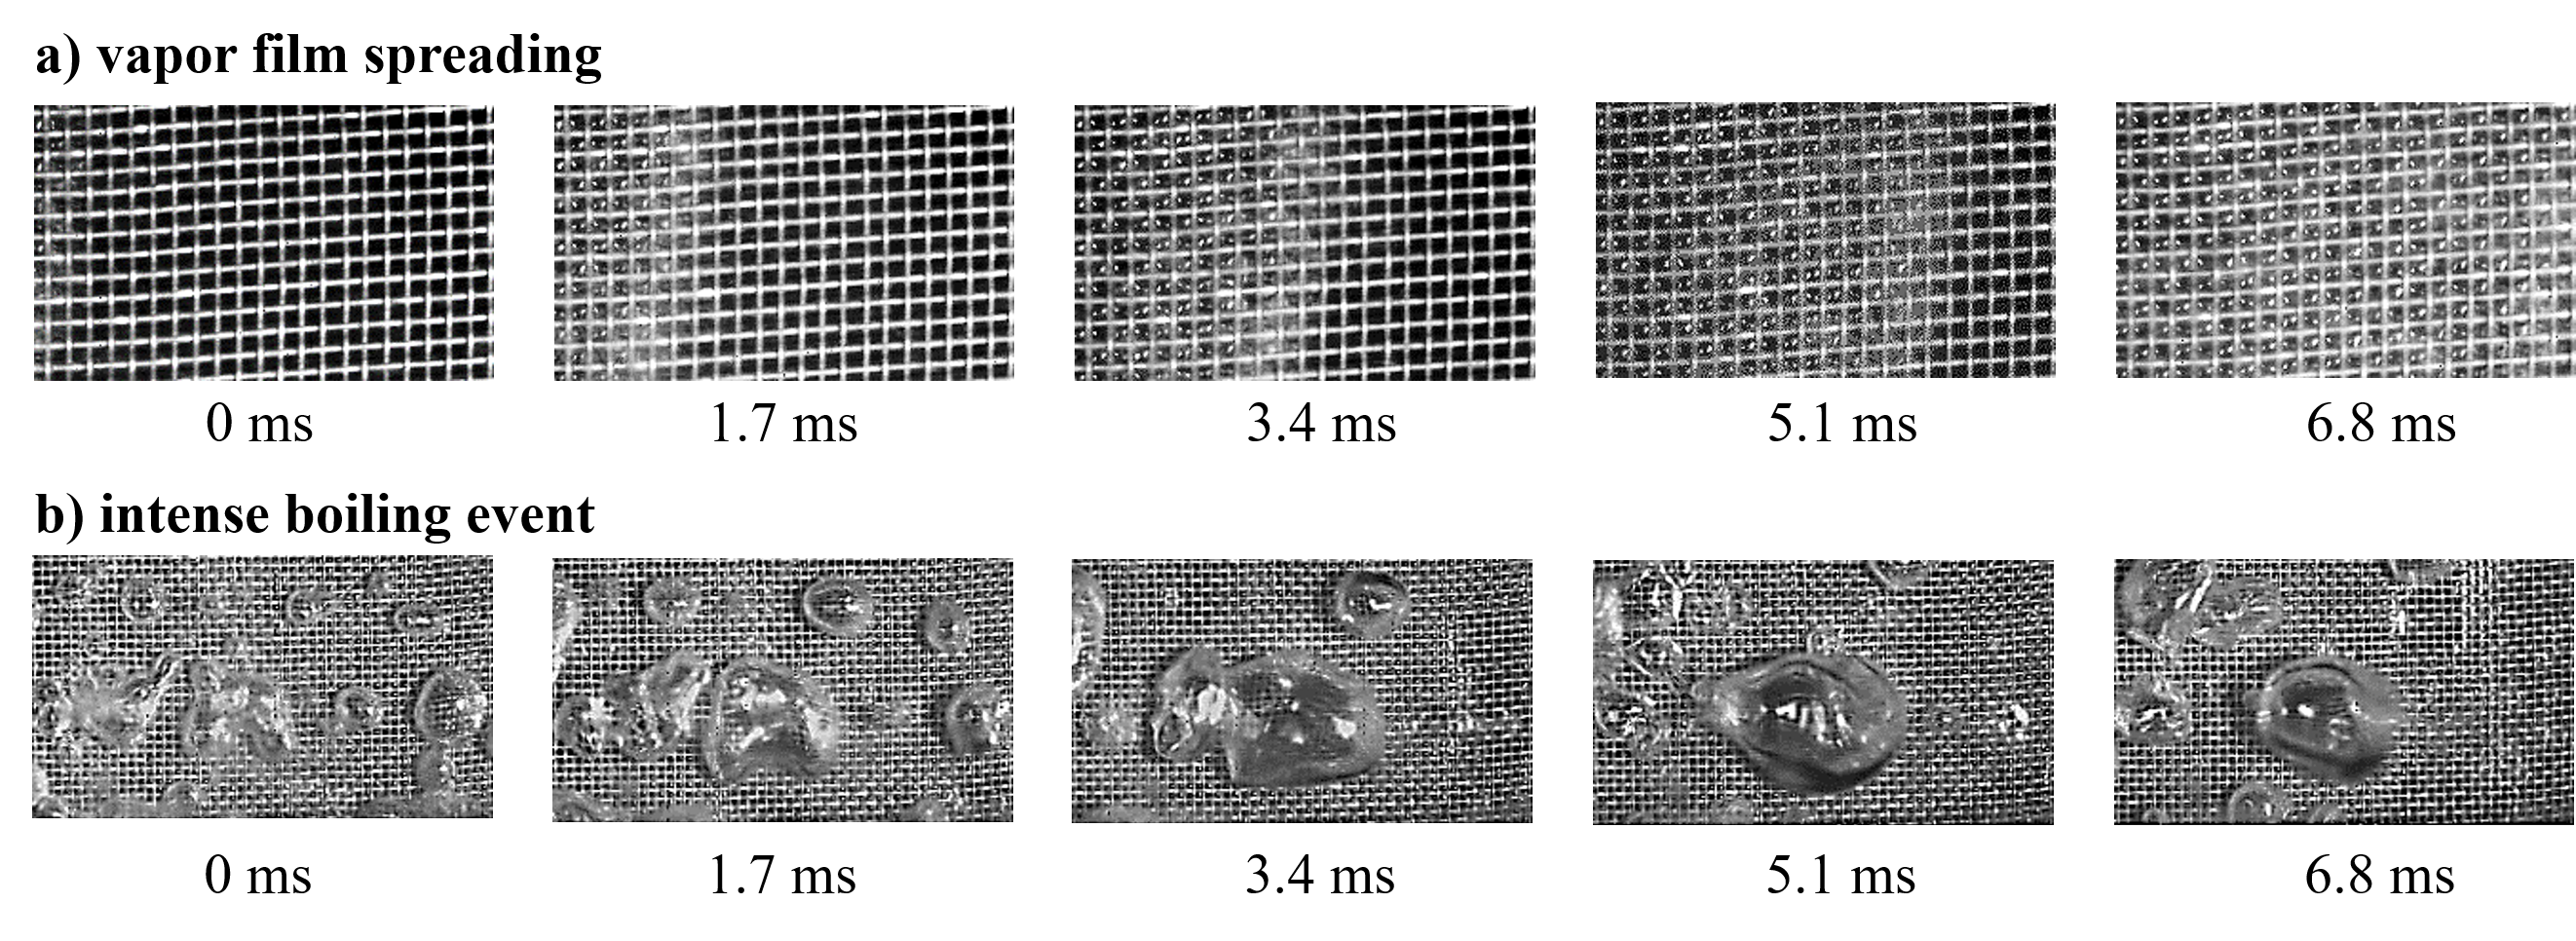
Fig. 8: Time stills of a) vapor film spreading, b) intense boiling event, c) isolated bubbles and bubble area fraction (AF)
Video 3: Intense boiling event. Top view of two-phase flow field for screen covered surface at 410 kg/m2s, 4.6 kW as captured by Photron high speed camera (10,000 fps).

Video 4: Vapor film spreading. Top view of two-phase flow field for screen covered surface at 410 kg/m2s, 4.6 kW as captured by Photron high speed camera (10,000 fps)